Things take a lot longer to correct in the options world, price can remain irrational for longer.
An options traders' main job is to find relationships that are out of line in the way options are priced and trade them against each other. These are spreads with relationships that revert to a certain value across most scenarios. Buying or selling such spreads at good prices is a large part of how options traders can make money. Only now it is a little bit harder for options traders.
In a liquid market, relationships will revert to their normal value more quickly. So, an options trader who recognizes an opportunity to buy something on the cheap, historically would be able to buy it, and within 1-2 days sell that spread out at a better price. In less liquid markets, like this one, it might take 5-6 days to sell that spread out... possibly more.
I believe this to be the challenge that options traders like myself are running into. There will be a spread that is 5 tics below value. We buy it. In a more liquid market where people were actively trading, we could sell that spread out the next day and lock in that 5 tics. Now, it might take 5 days to lock in that same 5 tics. So per day, that's 20% the profit of what it might be in a more liquid market. Holding a spread for 5 days makes it all the more risky. So trades that historically I wouldn't blink to do in size, I am hesitating to do at all. This is the downward liquidity spiral that is happening in front of our eyes. It is at the point where market makers, the ones who wake up looking to actively trade, are also finding fewer motivations to put on trades.
What can change all this? New interest in the market. It can come from
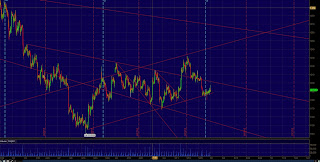
1) A break of the recent range. With such a defined range between 1175 and 1230 I think we can say at this point, any significant breaks from these points might be the catalyst for bringing new buyers or sellers into the market.
2) A down Stock market. It is hard to deny that most traders are wishing for a down stock market as a potential catalyst for other markets.
3) Change in regulation that makes it easier for more people to trade..... dont think this is happening any time soon so we will just avoid it
Above is a 90 day chart of gold (2hr). While since last look gold failed to hold, it found support at the uptrend line that I suggested might be forming. Resistance should come in at 1208 but for now the metal seems to have found a short term bottom. Be careful though, if this newly formed uptrend line starts to give way, we could see a quick and sharp drop toward 1150.

No comments:
Post a Comment